I measured the Spectral Photon Distribution of the three CFA filters of a Nikon D610 in ‘Daylight’ conditions with a cheap spectrometer. Taking a cue from this post I pointed it at light from the sun reflected off a gray card and took a raw capture of the spectrum it produced.

An ImageJ plot did the rest. I took a dozen captures at slightly different angles to catch the picture of the clearest spectrum. Shown are the three spectral curves averaged over the two best opposing captures, each proportional to the number of photons let through by the respective Color Filter. The units on the vertical axis are raw black-subtracted values from the raw file (DN), therefore the units on the vertical axis are proportional to the number of incident photons in each case. The Photopic Eye Luminous Efficiency Function (2 degree, Sharpe et al 2005) is also shown for reference, scaled to the same maximum as the green curve (although in energy units, my bad).

Each tiny peak and valley is repeatable and has a meaning – they mostly reflect absorption lines of sunlight as it travels through the atmosphere – they were all within a couple of nanometers of each other. Values are relative to each curve. The peak of the green curve is set by exposure. As far as the relative size of the R and B curves go there is a little more uncertainty connected to the angle of the camera to the spectrometer’s awkward display which tends to favor one end at the expense of the other, but in these conditions I would say no more than +/-10% for the same lens, in this case a Nikkor 16-85DX.
Also keep in mind that the relative size of the R and B curves varies considerably with the illuminant. My illuminant was the afternoon city sun reflected by a mirror directly onto an X-Rite gray-balance card, so I’ll deem it to be of ‘Daylight’ temperature, somewhere in the 5500K +/-5% range. Nikon also applies White Balance Pre-Conditioning to the B and R data off the ADC before writing it to the raw file.
Note first how the majority of the overall energy allowed through to silicon by the CFA appears to be between 430-670nm, even though by looking at the data in log format one can see that neither the blue nor the red curves have leveled off completely at their respective ends. 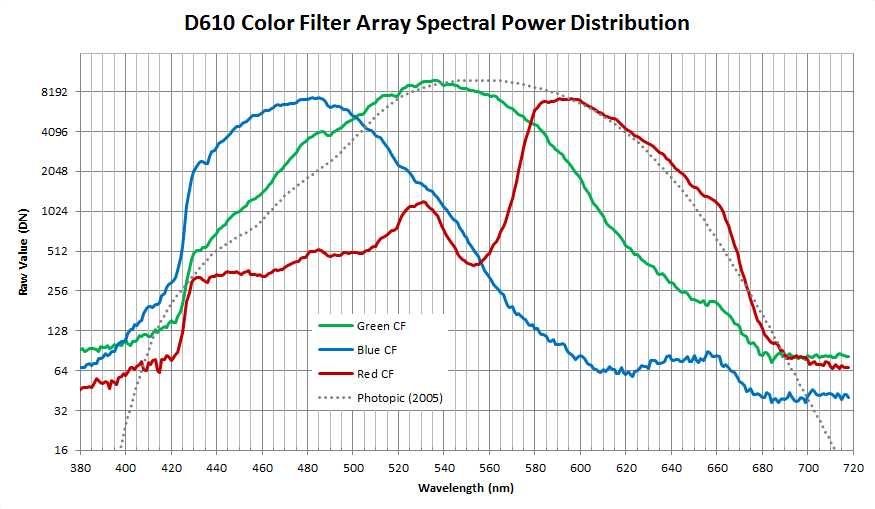
This may be a limitation of capturing the spectrum at the corners of my cheap setup, where I did not have the time to hunt down a certain amount of flare inside the spectrometer. Note also what appears like the characteristic slope of a low pass (IR) filter in the red channel starting at about 600nm.
Second, the peak wavelength of the three filters over my dozen or so captures were 485, 536 and 596nm for the B,G and R curves respectively, all within a couple of nm.
Of more interest to me was the energy of the average photon passed by each filter (expressed in terms of the wavelength of the photon of average energy, see relative formula further down)
![\[\lambda_{ave}_{E} = \frac{\int\limits_{\lambda_1}^{\lambda_2} f(\lambda) \, \lambda \, d\lambda}{\int\limits_{\lambda_1}^{\lambda_2} f(\lambda) \, d\lambda}\]](https://i0.wp.com/www.strollswithmydog.com/wordpress/wp-content/ql-cache/quicklatex.com-3e0a567aa87bcad9f31fdbe10bf35386_l3.png?resize=158%2C102&ssl=1 "Rendered by QuickLaTeX.com")
in the same units as the wavelength, with  corresponding to
  depending on the channel; and the half-power bandwidth within the passband of each channel, as depicted below for the green one

And here are the results for all three channels from the two averaged captures:

I feel comfortable that these figures are accurate within the +/- 5nm spec of the spectrometer.
Another interesting figure that can be estimated is the approximate percentage of photons within the passband that each CFA filter lets through, assuming a flat incoming spectral photon distribution and curves determined by my ‘Daylight’ illuminant and lens. The curves are normalized so that 100% of photons at the peak of the green color filter make it through to silicon, which is obviously not the case. The R and B figures are probably slightly overestimated as a result of Nikon’s WB pre-conditioning of the raw data. I will take the passband to be 10 stops down from the peak of the photopic curve, 395-718nm (a value of 10 in figures 2 and 3 above):
G = 27.1%, B = 16.3%, R = 14.8%.
Lots of assumptions here, so take these figures with a grain of salt. For reference, with the same criteria the photopic curve would let through 34.7% of photons with a constant spectral distribution.
Wavelength information is directly related to the energy ( ) of the incoming photons by the relationship
![\[E = \frac{hc}{\lambda}\]](https://i0.wp.com/www.strollswithmydog.com/wordpress/wp-content/ql-cache/quicklatex.com-24f842ec0f3973f43ab971136fe1f7b0_l3.png?resize=58%2C37&ssl=1 "Rendered by QuickLaTeX.com")
in joules, with  Planck’s constant and
  the speed of light respectively. For instance the Energy of the average photon that makes it through to silicon under the Green CFA of my D610 is about 3.713e-19 joules. This information comes in handy when modeling optics or estimating QE.
Since I had the equipment out the next day I also took one quick capture with an aging D90 to see whether Nikon’s CFA recipe had changed over the years. It seems that it hasn’t much.

With a few exceptions the curves overlay each other well, the peaks are within the accuracy of the setup and the wavelength of the average photon let through by each filter is within a couple of nm. So perhaps these curves could be representative of the Spectral Photon Distribution of the CFAs under a ‘Daylight’ illuminant in Nikon’s recent cameras circa 2014, at least as far as DSLRs are concerned.

P.S. A reader went further than I did with a similar setup, using known Illuminant A (a tungsten bulb) and calibrating it out. These are the Spectral Sensitivity Functions of his D600 mounting a 35mm Sigma Art. Nice!

BTW I chose the Project STAR Spectrometer because it was designed by a team at Harvard to be capable of 1nm precision in the right hands. Not mine evidently:-).
Red looks real indeed but green seems got some shift to the right side, and blue looks very different vs others nikon’s http://www.gujinwei.org/research/camspec/
Great reference, thanks. It looks like at the extremes my cheap setup hits its limitations. And don’t forget that these curves represent the number of incident photons at each small wavelength interval while those represent energy.
Hi Jack, I think you can improve the test precision a lot, if you’ll use calibrated input power distribution spectrum yet(my i1pro I bought ebay for $300). Also would be nice to calibrate your spectroscope nm (lambda) scale, because looks like the lambda shift getting higher from 400 to 700nm’s. Try to test some blue LED’s with known spectrum at rated current (just from its PDF, that’s important, cause b LED’s slides down to cyan if overloaded. BTW, it is possible to make some nm sweep on this effect).
PS: about link I posted, I have doubts about their recovering method yet, and don’t understand why they call it PCS if actually just linear algebra in use(I had read matlab code, it’s looks a bit fishy for me).. But ground truth CFA’s probably measured Ok.
Thanks E1, excellent suggestions. I will rivisit this when I have a little time.
Hi Jack, I bought similar spectroscope, and tried calibrate it, max error was about 10nm. Under illuminant A the CFA of my D600+Sigma 35 1.4 ART looks like that https://yadi.sk/d/dKRRtCyFeYJKz This is calibration points, fluorescent cold bulb, I1pro and spectroscope edge/center https://yadi.sk/d/4iur6VhkeYK7X
Excellent, E1. It looks like your setup is better able to reach the edges of the range. Peak green channel still around 535nm. Do you mind if I append your graph to the article?
It’s ok but this one just my very first and single attempt, I’m sure real CFA is still not exactly the same (worrying about not typical bottom area of G, probably it is parasitic light leakage). ICM (XYZ 33^3 cLUT) that I built according obtained data is quite strange. ICM from d3/d3x/d90/k5 CFA http://www.cis.rit.edu/jwgu/research/camspec/db.php looks quite ok for my d600, didn’t check dE but at least pics doesn’t looks odd.
It looks good. Only surprise is the relative strength of the blue channel under Illuminant A. Are these normalized to Se? I noticed that not beeing 100% square to the spectral plane made a significant difference, so I averaged readings from straight on and from slightly offset angles left and right. As I mention in the article I don’t think we can trust relative CFA strength given the cheap setup, but I hope the peaks and valleys are within range. Plus my curves refer to a ‘Daylight’ illuminant. Jack