Determining the Signal to Noise Ratio (SNR) curves of your digital camera at various ISOs and extracting from them the underlying IQ metrics of its sensor can help answer a number of questions useful to photography. For instance whether/when to raise ISO; what its dynamic range is; how noisy its output could be in various conditions; or how well it is likely to perform compared to other Digital Still Cameras. As it turns out obtaining the relative data is a little time consuming but not that hard. All you need is your camera, a suitable target, a neutral density filter, dcraw or libraw or similar software to access the linear raw data – and a spreadsheet.
Signal to Noise Ratio for our purposes is defined as the mean divided by the standard deviation of the raw data in a patch captured by our camera when a suitable target is illuminated uniformly. We are after the standard deviation caused by random noise in the light and conversion process itself only. Therefore in order to eliminate any space dependent variables (like slightly uneven illumination or pattern noise) we take captures in pairs and subtract them in order to isolate the random components. Here is one simple procedure you can follow to collect the relevant data.
Start by finding a uniform diffuse target and illuminating it with a light source of close to daylight temperature (5300 °K +/- 10%), for no other reason than it represents a fairly balanced illuminant. Direct sunlight is good but halogen lamps work just as well, keeping in mind that the signal in blue wavelengths will be much less than in red ones. Illumination should be diffused and uniform on the target so as not to create specular reflections and minimize gradients across it.
The target should be perfectly clean, neutral, uniform and reflect light diffusely. White paper is often not ideal because of its rugosity, imperfections and chemicals that are sometimes used to make it appear ‘ultra’ bright. The white balance page of Xrite’s ColorChecker Passport seems to work well for me.
Clean the sensor with a blower. Position the camera on a sturdy tripod so that it is square to the target and away from the reflected family of angles from the light source. We are interested in an 300×300 pixel area in the center of the frame so that each of the four color channels will collect more than 20,000 samples, which should keep errors to less than 1%. We want the capture to be slightly out of focus so that any imperfections will be averaged out.
Expose to the right (ETTR) at base ISO ensuring that data from the target is not clipped in the raw file using a tool like RawDigger. For a 14-bit camera an average reading in the green channel of 10,000 ADUs (raw levels) or less normally works well.
Using good technique (eyepiece cap, NR off, VR off, delayed release, mirror up/EFCS/silent shooting, shutter speed faster than suspected subliminal Long Exposure noise reduction and away from suspected shutter shock territory) take two raw captures one after the other. Reduce Exposure by one stop (or 1/3 of a stop if you prefer) and repeat taking capture pairs until you hit minimum shutter speed and aperture. We want to be able to record image pairs at least as many stops down from clipping as the bit depth, for instance 14 stops down for a 14-bit camera. If you can’t reach that depth introduce a neutral density filter and adjust Exposure to help you cover the last few stops. The last four stops or so are critical, so ideally you would capture them at a 1/3 stop interval.
When done put on the lens cap, minimize shutter speed and aperture, turn off all the lights and take two more ‘dark field’ captures, representing zero signal. Then raise ISO one stop (or 1/3 of a stop if you prefer) and start all over again for as many ISO settings as you wish to have data for.
When done you will have several dozen image pairs. The objective is to obtain from them SNR curves as a function of Exposure or Intensity at each ISO for each of the four raw channels.
Using a program like Matlab, Octave or imageJ unpack the raw capture pairs with dcraw -d -4 -T or similar command for your raw opener of choice, crop the central 300×300 pixels in the frames, separate the four raw channels then create two arrays from each raw channel pair, a sum and a difference: add the pair together; subtract one image of the pair from the other. Then measure the mean in the summed array and the standard deviation in the subtracted one. Divide the mean by two and the standard deviation by the square root of two (random noise adds and subtracts as a quadrature sum).
The signal to noise ratio performance of the sensor estimated at the given Exposure pair is simply the ratio of the mean and the standard deviation so derived:

Once you have performed the calculations for all captured pairs you can plot the SNR vs mean curve for each of the four channels at every recorded ISO setting . Here is the green channel of a Nikon D810 at base ISO on a log-log scale as an example (quality Jim Kasson data):
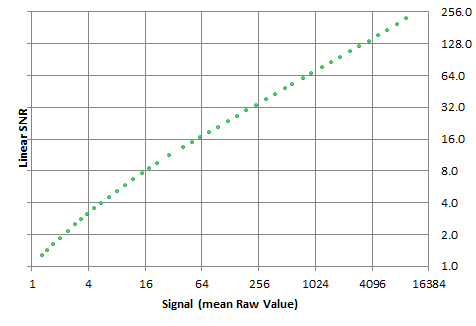
The straight slope of the upper portion of the SNR curve is due to shot noise while deviation from it at lower signal levels is caused by the increasing impact of electronic (read) noise. PRNU (Pixel Response Non Uniformity) is apparently absent at the top of the range because we effectively canceled it out by subtracting image pairs. To measure it, make sure that there are no gradients or other non-uniformities in your captures and calculate mean and standard deviation from single images, without correction factors.
Depending on your camera you may have to discard some of the lowest SNR data points: offset, truncation, quantization and other effects conspire to keep noise in the deepest shadows from behaving strictly according to theory. If you leave that data in there it may skew further analysis. If these effects show up (as they do in very clean sensors like the D7200, a7S and D810), they typically only manifest themselves in the lowest couple of ISOs at an SNR of less than 2, especially in the red and blue channels that may have been subjected to pre-scaling before being written to the raw data.
There are faster ways to perform this feat, including using gradients to your advantage, but you get the idea. Now that you have SNR data in a future post I will describe how to use a spreadsheet like Excel to extract key sensor metrics from it like saturation/clipping/full well count, read noise, gain and more.
PS Inspiration for this procedure was provided by Emil Martinec’s excellent noise pages.
Many of us do not know exactly how to measure the performance of our digital camera and I am sure that a lot of people will find this blog post very helpful in the long run when examining their own camera.