Tag Archives: Photography

Photons, Shot Noise and Poisson Processes

Every digital photographer soon discovers that there are three main sources of visible random noise that affect pictures taken in normal conditions: Shot, pixel response non-uniformities (PRNU) and Read noise.[1]

Shot noise (sometimes referred to as Photon Shot Noise or Photon Noise) we learn is ‘inherent in light’; PRNU is per pixel gain variation proportional to light, mainly affecting the brighter portions of our pictures; Read Noise is instead independent of light, introduced by the electronics and visible in the darker shadows.  You can read in this earlier post a little more detail on how they interact.

Read Noise Shot Photon PRNU Photo Resonse Non Uniformity

However, shot noise is omnipresent and arguably the dominant source of visible noise in typical captures.  This article’s objective is to  dig deeper into the sources of Shot Noise that we see in our photographs: is it really ‘inherent in the incoming light’?  What about if the incoming light went through clouds or was reflected by some object at the scene?  And what happens to the character of the noise as light goes through the lens and is turned into photoelectrons by a pixel’s photodiode?

Fish, dear reader, fish and more fish.

Continue reading Photons, Shot Noise and Poisson Processes

Diffracted DOF Aperture Guides: 24-35mm

As a landscape shooter I often wonder whether old rules for DOF still apply to current small pixels and sharp lenses. I therefore roughly measured  the spatial resolution performance of my Z7 with 24-70mm/4 S in the center to see whether ‘f/8 and be there’ still made sense today.  The journey and the diffraction-simple-aberration aware model were described in the last few posts.  The results are summarized in the Landscape Aperture-Distance charts presented here for the 24, 28 and 35mm focal lengths.

I also present the data in the form of a simplified plot to aid making the right compromises when the focusing distance is flexible.  This information is valid for the Z7 and kit in the center only.  It probably just as easily applies to cameras with similarly spec’d pixels and lenses. Continue reading Diffracted DOF Aperture Guides: 24-35mm

DOF and Diffraction: 24mm Guidelines

After an exhausting two and a half hour hike you are finally resting, sitting on a rock at the foot of your destination, a tiny alpine lake, breathing in the thin air and absorbing the majestic scenery.  A cool light breeze suddenly rips the surface of the water, morphing what has until now been a perfect reflection into an impressionistic interpretation of the impervious mountains in the distance.

The beautiful flowers in the foreground are so close you can touch them, the reflection in the water 10-20m away, the imposing mountains in the background a few hundred meters further out.  You realize you are hungry.  As you search the backpack for the two panini you prepared this morning you begin to ponder how best to capture the scene: subject,  composition, Exposure, Depth of Field.

Figure 1. A typical landscape situation: a foreground a few meters away, a mid-ground a few tens and a background a few hundred meters further out.  Three orders of magnitude.  The focus point was on the running dog, f/16, 1/100s.  Was this a good choice?

Depth of Field.  Where to focus and at what f/stop?  You tip your hat and just as you look up at the bluest of blue skies the number 16 starts enveloping your mind, like rays from the warm noon sun. You dial it in and as you squeeze the trigger that familiar nagging question bubbles up, as it always does in such conditions.  If this were a one shot deal, was that really the best choice?

In this article we attempt to provide information to make explicit some of the trade-offs necessary in the choice of Aperture for 24mm landscapes.  The result of the process is a set of guidelines.  The answers are based on the previously introduced diffraction-aware model for sharpness in the center along the depth of the field – and a tripod-mounted Nikon Z7 + Nikkor 24-70mm/4 S kit lens at 24mm.
Continue reading DOF and Diffraction: 24mm Guidelines

DOF and Diffraction: Setup

The two-thin-lens model for precision Depth Of Field estimates described in the last two articles is almost ready to be deployed.  In this one we will describe the setup that will be used to develop the scenarios that will be outlined in the next one.

The beauty of the hybrid geometrical-Fourier optics approach is that, with an estimate of the field produced at the exit pupil by an on-axis point source, we can generate the image of the resulting Point Spread Function and related Modulation Transfer Function.

Pretend that you are a photon from such a source in front of a f/2.8 lens focused at 10m with about 0.60 microns of third order spherical aberration – and you are about to smash yourself onto the ‘best focus’ observation plane of your camera.  Depending on whether you leave exactly from the in-focus distance of 10 meters or slightly before/after that, the impression you would leave on the sensing plane would look as follows:

Figure 1. PSF of a lens with about 0.6um of third order spherical aberration focused on 10m.

The width of the square above is 30 microns (um), which corresponds to the diameter of the Circle of Confusion used for old-fashioned geometrical DOF calculations with full frame cameras.  The first ring of the in-focus PSF at 10.0m has a diameter of about 2.44\lambda \frac{f}{D} 
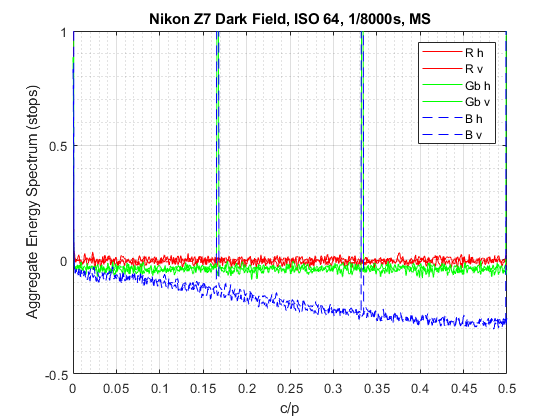
= 3.65 microns.   That’s about the size of the estimated effective square pixel aperture of the Nikon Z7 camera that we are using in these tests.
Continue reading DOF and Diffraction: Setup

DOF and Diffraction: Image Side

This investigation of the effect of diffraction on Depth of Field is based on a two-thin-lens model, as suggested by Alan Robinson[1].  We chose this model because it allows us to associate geometrical optics with one lens and Fourier optics with the other, thus simplifying the underlying math and our understanding.

In the last article we discussed how the front element of the model could present at the rear element the wavefront resulting from an on-axis source as a function of distance from the lens.  We accomplished this by using simple geometry in complex notation.  In this one we will take the relative wavefront present at the exit pupil and project it onto the sensing plane, taking diffraction into account numerically.  We already know how to do it since we dealt with this subject in the recent past.

Figure 1. Where is the plane with the Circle of Least Confusion?  Through Focus Line Spread Function Image of a lens at f/2.8 with the indicated third order spherical aberration coefficient, and relative measures of ‘sharpness’ MTF50 and Acutance curves.  Acutance is scaled to the same peak as MTF50 for ease of comparison and refers to my typical pixel peeping conditions: 100% zoom, 16″ away from my 24″ monitor.

Continue reading DOF and Diffraction: Image Side

DOF and Diffraction: Object Side

In this and the following articles we shall explore the effects of diffraction on Depth of Field through a two-lens model that separates geometrical and Fourier optics in a way that keeps the math simple, though via complex notation.  In the process we will gain a better understanding of how lenses work.

The results of the model are consistent with what can be obtained via classic DOF calculators online but should be more precise in critical situations, like macro photography.  I am not a macro photographer so I would be interested in validation of the results of the explained method by someone who is.

Figure 1. Simple two-thin-lens model for DOF calculations in complex notation.  Adapted under licence.

Continue reading DOF and Diffraction: Object Side

The HV Spectrogram

A spectrogram, also sometimes referred to as a periodogram, is  a visual representation of the Power Spectrum of a signal.  Power Spectrum answers the question “How much power is contained in the frequency components of the signal”. In digital photography a Power Spectrum can show the relative strength of repeating patterns in captures and whether processing has been applied.

In this article I will describe how you can construct a spectrogram and how to interpret it, using dark field raw images taken with the lens cap on as an example.  This can tell us much about the performance of our imaging devices in the darkest shadows and how well tuned their sensors are there.

Pixel level noise spectrum
Figure 1. Horizontal and Vertical Spectrogram of noise captured in the raw data by a Nikon Z7 at base ISO with  the lens cap on.  The plot shows clear evidence of low-pass filtering in the blue CFA color plane and pattern noise repeating every 6 rows there and in one of the green ones.

Continue reading The HV Spectrogram

The Richardson-Lucy Algorithm

Deconvolution by the Richardson-Lucy algorithm is achieved by minimizing the convex loss function derived in the last article

(1)   \begin{equation*} J(O) = \sum \bigg (O**PSF - I\cdot ln(O**PSF) \bigg) \end{equation*}

with

  • J, the scalar quantity to minimize, function of ideal image O(x,y)
  • I(x,y), linear captured image intensity laid out in M rows and N columns, corrupted by Poisson noise and blurring by the PSF
  • PSF(x,y), the known two-dimensional Point Spread Function that should be deconvolved out of I
  • O(x,y), the output image resulting from deconvolution, ideally without shot noise and blurring introduced by the PSF
  • **   two-dimensional convolution
  • \cdot   element-wise product
  • ln, element-wise natural logarithm

In what follows indices x and y, from zero to M-1 and N-1 respectively, are dropped for readability.  Articles about algorithms are by definition dry so continue at your own peril.

So, given captured raw image I blurred by known function PSF, how do we find the minimum value of J yielding the deconvolved image O that we are after?

Continue reading The Richardson-Lucy Algorithm

Elements of Richardson-Lucy Deconvolution

We have seen that deconvolution by naive division in the frequency domain only works in ideal conditions not typically found in normal photographic settings, in part because of shot noise inherent in light from the scene. Half a century ago William Richardson (1972)[1] and Leon Lucy (1974)[2] independently came up with a better way to deconvolve blurring introduced by an imaging system in the presence of shot noise. Continue reading Elements of Richardson-Lucy Deconvolution

The Perfect Color Filter Array

We’ve seen how humans perceive color in daylight as a result of three types of photoreceptors in the retina called cones that absorb wavelengths of light from the scene with different sensitivities to the arriving spectrum.

Figure 1.  Quantitative Color Science.

A photographic digital imager attempts to mimic the workings of cones in the retina by usually having different color filters arranged in an array (CFA) on top of its photoreceptors, which we normally call pixels.  In a Bayer CFA configuration there are three filters named for the predominant wavelengths that each lets through (red, green and blue) arranged in quartets such as shown below:

Figure 2.  Bayer Color Filter Array: RGGB  layout.  Image under license from Cburnett, pixels shifted and text added.

A CFA is just one way to copy the action of cones:  Foveon for instance lets the sensing material itself perform the spectral separation.  It is the quality of the combined spectral filtering part of the imaging system (lenses, UV/IR, CFA, sensing material etc.) that determines how accurately a digital camera is able to capture color information from the scene.  So what are the characteristics of better systems and can perfection be achieved?  In this article I will pick up the discussion where it was last left off and, ignoring noise for now, attempt to answer this  question using CIE conventions, in the process gaining insight in the role of the compromise color matrix and developing a method to visualize its effects.[1]  Continue reading The Perfect Color Filter Array

Phase One IQ3 100MP Trichromatic vs Standard Back Linear Color, Part I

It is always interesting when innovative companies push the envelope of the state-of-the-art of a single component in their systems because a lot can be learned from before and after comparisons.   I was therefore excited when Phase One introduced a Trichromatic version of their Medium Format IQ3 100MP Digital Back last September because it could allows us to isolate the effects of tweaks to their Bayer Color Filter Array, assuming all else stays the same.

Figure 1. IQ3 100MP Trichromatic (left) vs the rest (right), from PhaseOne.com.   Units are not specified but one would assume that the vertical axis is relative spectral sensitivity and the horizontal axis represents wavelength.

Thanks to two virtually identical captures by David Chew at getDPI, and Erik Kaffehr’s intelligent questions at DPR, in the following articles I will explore the effect on linear color of the new Trichromatic CFA (TC) vs the old one on the Standard Back (SB).  In the process we will discover that – within the limits of my tests, procedures and understanding[1] – the Standard Back produces apparently more ‘accurate’ color while the Trichromatic produces better looking matrices, potentially resulting in ‘purer’ signals. Continue reading Phase One IQ3 100MP Trichromatic vs Standard Back Linear Color, Part I

Wavefront to PSF to MTF: Physical Units

In the last article we saw that the intensity Point Spread Function and the Modulation Transfer Function of a lens could be easily approximated numerically by applying Discrete Fourier Transforms to its generalized exit pupil function \mathcal{P} twice in sequence.[1]

Numerical Fourier Optics: amplitude Point Spread Function, intensity PSF and MTF

Obtaining the 2D DFTs is easy: simply feed MxN numbers representing the two dimensional complex image of the Exit Pupil function in its uv space to a Fast Fourier Transform routine and, presto, it produces MxN numbers representing the amplitude of the PSF on the xy sensing plane.  Figure 1a shows a simple case where pupil function \mathcal{P} is a uniform disk representing the circular aperture of a perfect lens with MxN = 1024×1024.  Figure 1b is the resulting intensity PSF.

Figure 1a, left: A circular array of ones appearing as a white disk on a black background, representing a circular aperture. Figure 1b, right: Array of numbers representing the PSF of image 1a in the classic shape of an Airy Pattern.
Figure 1. 1a Left: Array of numbers representing a circular aperture (zeros for black and ones for white).  1b Right: Array of numbers representing the PSF of image 1a (contrast slightly boosted).

Simple and fast.  Wonderful.  Below is a slice through the center, the 513th row, zoomed in.  Hmm….  What are the physical units on the axes of displayed data produced by the DFT? Continue reading Wavefront to PSF to MTF: Physical Units

Linear Color: Applying the Forward Matrix

Now that we know how to create a 3×3 linear matrix to convert white balanced and demosaiced raw data into XYZ_{D50}  connection space – and where to obtain the 3×3 linear matrix to then convert it to a standard output color space like sRGB – we can take a closer look at the matrices and apply them to a real world capture chosen for its wide range of chromaticities.

Figure 1. Image with color converted using the forward linear matrix discussed in the article.

Continue reading Linear Color: Applying the Forward Matrix

Color: Determining a Forward Matrix for Your Camera

We understand from the previous article that rendering color with Adobe DNG raw conversion essentially means mapping raw data in the form of rgb triplets into a standard color space via a Profile Connection Space in a two step process

    \[ Raw Data \rightarrow  XYZ_{D50} \rightarrow RGB_{standard} \]

The first step white balances and demosaics the raw data, which at that stage we will refer to as rgb, followed by converting it to XYZ_{D50} Profile Connection Space through linear projection by an unknown ‘Forward Matrix’ (as DNG calls it) of the form

(1)   \begin{equation*} \left[ \begin{array}{c} X_{D50} \\ Y_{D50} \\ Z_{D50} \end{array} \right] = \begin{bmatrix} a_{11} & a_{12} & a_{13} \\ a_{21} & a_{22} & a_{23} \\ a_{31} & a_{32} & a_{33} \end{bmatrix} \left[ \begin{array}{c} r \\ g \\ b \end{array} \right] \end{equation*}

with data as column-vectors in a 3xN array.  Determining the nine a coefficients of this matrix M is the main subject of this article[1]. Continue reading Color: Determining a Forward Matrix for Your Camera

Color: From Object to Eye

How do we translate captured image information into a stimulus that will produce the appropriate perception of color?  It’s actually not that complicated[1].

Recall from the introductory article that a photon absorbed by a cone type (\rho, \gamma or \beta) in the fovea produces the same stimulus to the brain regardless of its wavelength[2].  Take the example of the eye of an observer which focuses  on the retina the image of a uniform object with a spectral photon distribution of 1000 photons/nm in the 400 to 720nm wavelength range and no photons outside of it.

Because the system is linear, cones in the foveola will weigh the incoming photons by their relative sensitivity (probability) functions and add the result up to produce a stimulus proportional to the area under the curves.  For instance a \gamma cone may see about 321,000 photons arrive and produce a relative stimulus of about 94,700, the weighted area under the curve:

equal-photons-per-wl
Figure 1. Light made up of 321k photons of broad spectrum and constant Spectral Photon Distribution between 400 and 720nm  is weighted by cone sensitivity to produce a relative stimulus equivalent to 94,700 photons, proportional to the area under the curve

Continue reading Color: From Object to Eye

A Longitudinal CA Metric for Photographers

While perusing Jim Kasson’s excellent Longitudinal Chromatic Aberration tests[1] I was impressed by the quantity and quality of the information the resulting data provides.  Longitudinal, or Axial, CA is a form of defocus and as such it cannot be effectively corrected during raw conversion, so having a lens well compensated for it will provide a real and tangible improvement in the sharpness of final images.  How much of an improvement?

In this article I suggest one such metric for the Longitudinal Chromatic Aberrations (LoCA) of a photographic imaging system: Continue reading A Longitudinal CA Metric for Photographers

Linearity in the Frequency Domain

For the purposes of ‘sharpness’ spatial resolution measurement in photography  cameras can be considered shift-invariant, linear systems.

Shift invariant means that the imaging system should respond exactly the same way no matter where light from the scene falls on the sensing medium .  We know that in a strict sense this is not true because for instance a pixel has a square area so it cannot have an isotropic response by definition.  However when using the slanted edge method of linear spatial resolution measurement  we can effectively make it shift invariant by careful preparation of the testing setup.  For example the edges should be slanted no more than this and no less than that. Continue reading Linearity in the Frequency Domain

Engineering Dynamic Range in Photography

Dynamic Range (DR) in Photography usually refers to the linear working signal range, from darkest to brightest, that the imaging system is capable of capturing and/or displaying.  It is expressed as a ratio, in stops:

    \[ DR = log_2(\frac{Maximum Acceptable Signal}{Minimum Acceptable Signal}) \]

It is a key Image Quality metric because photography is all about contrast, and dynamic range limits the range of recordable/ displayable tones.  Different components in the imaging system have different working dynamic ranges and the system DR is equal to the dynamic range of the weakest performer in the chain.

Continue reading Engineering Dynamic Range in Photography

The Units of Spatial Resolution

Several sites for photographers perform spatial resolution ‘sharpness’ testing of a specific lens and digital camera set up by capturing a target.  You can also measure your own equipment relatively easily to determine how sharp your hardware is.  However comparing results from site to site and to your own can be difficult and/or misleading, starting from the multiplicity of units used: cycles/pixel, line pairs/mm, line widths/picture height, line pairs/image height, cycles/picture height etc.

This post will address the units involved in spatial resolution measurement using as an example readings from the popular slanted edge method, although their applicability is generic.

Continue reading The Units of Spatial Resolution

How to Get MTF Performance Curves for Your Camera and Lens

You have obtained a raw file containing the image of a slanted edge  captured with good technique.  How do you get the Modulation Transfer Function of the camera and lens combination that took it?  Download and feast your eyes on open source MTF Mapper version 0.4.16 by Frans van den Bergh.

[Edit 2023: MTF Mapper has kept improving over the years, making it in my opinion the most accurate slanted edge measuring tool available today, used in applications that range from photography to machine vision to the Mars Rover.   Did I mention that it is open source?

It now sports a Graphical User Interface which can load raw files and allow the arbitrary selection of individual edges by simply pointing and clicking, making this post largely redundant.  The procedure outlined below will still work but there are easier ways to accomplish the same task today: just “File/Open single edge image” raw files from the GUI after having inserted “–bayer green” in the additional string field.  Thanks Frans.]

The first thing we are going to do is crop the edges and package them into a TIFF file format so that MTF Mapper has an easier time reading them.  Let’s use as an example a Nikon D810+85mm:1.8G ISO 64 studio raw capture by DPReview so that you can follow along if you wish.   Continue reading How to Get MTF Performance Curves for Your Camera and Lens

What is the Effective Quantum Efficiency of my Sensor?

Now that we know how to determine how many photons impinge on a sensor we can estimate its Effective Quantum Efficiency, that is the efficiency with which it turns such a photon flux (n_{ph}) into photoelectrons (n_{e^-} ), which will then be converted to raw data to be stored in the capture’s raw file:

(1)   \begin{equation*} EQE = \frac{n_{e^-} \text{ produced by average pixel}}{n_{ph} \text{ incident on average pixel}} \end{equation*}

I call it ‘Effective’, as opposed to ‘Absolute’, because it represents the probability that a photon arriving on the sensing plane from the scene will be converted to a photoelectron by a given pixel in a digital camera sensor.  It therefore includes the effect of microlenses, fill factor, CFA and other filters on top of silicon in the pixel.  Whether Effective or Absolute, QE is usually expressed as a percentage, as seen below in the specification sheet of the KAF-8300 by On Semiconductor, without IR/UV filters:

For instance if  an average of 100 photons per pixel were incident on a uniformly lit spot on the sensor and on average each pixel produced a signal of 20 photoelectrons we would say that the Effective Quantum Efficiency of the sensor is 20%.  Clearly the higher the EQE the better for Image Quality parameters such as SNR. Continue reading What is the Effective Quantum Efficiency of my Sensor?

Exposure and ISO

The in-camera ISO dial is a ballpark milkshake of an indicator to help choose parameters that will result in a ‘good’ perceived picture. Key ingredients to obtain a ‘good’ perceived picture are 1) ‘good’ Exposure and 2) ‘good’ in-camera or in-computer processing. It’s easier to think about them as independent processes and that comes naturally to you because you shoot raw in manual mode and you like to PP, right? Continue reading Exposure and ISO

What Is Exposure

When capturing a typical photograph, light from one or more sources is reflected from the scene, reaches the lens, goes through it and eventually hits the sensing plane.

In photography Exposure is the quantity of visible light per unit area incident on the image plane during the time that it is exposed to the scene.  Exposure is intuitively proportional to Luminance from the scene $L$ and exposure time $t$.  It is inversely proportional to lens f-number $N$ squared because it determines the relative size of the cone of light captured from the scene.  You can read more about the theory in the article on angles and the Camera Equation.

Continue reading What Is Exposure