You have obtained a raw file containing the image of a slanted edge captured with good technique. How do you get the Modulation Transfer Function of the camera and lens combination that took it? Download and feast your eyes on open source MTF Mapper version 0.4.16 by Frans van den Bergh.
[Edit, several years later: MTF Mapper has kept improving over time, making it in my opinion the most accurate slanted edge measuring tool available today, used in applications that range from photography to machine vision to the Mars Rover. Did I mention that it is open source?
It now sports a Graphical User Interface which can load raw files and allow the arbitrary selection of individual edges by simply pointing and clicking, making this post largely redundant. The procedure outlined will still work but there are easier ways to accomplish the same task today. To obtain the same result with raw data and version 0.7.38 just install MTF Mapper, set the “Settings/Preferences” tab as follows and leave all else at default:

“Pixel size” is only needed to also show SFR in units of lp/mm and the “Arguments” field only if using an unspecified raw data CFA layout. “Accept” and “File/Open with manual edge selection” your raw files. Follow the instructions to select as many edges as desired. Then in “Data set” open an “annotated” file and shift-click on the chosen edges to see the relative MTF plots.]
The first thing we are going to do is crop the edges and package them into a TIFF file format so that MTF Mapper has an easier time reading them. Let’s use as an example a Nikon D810+85mm:1.8G ISO 64 studio raw capture by DPReview so that you can follow along if you wish. By clicking on the ‘RAW’ link below the central target, raw file 0006-ISO64-1_25s.NEF will download. It looks like this:
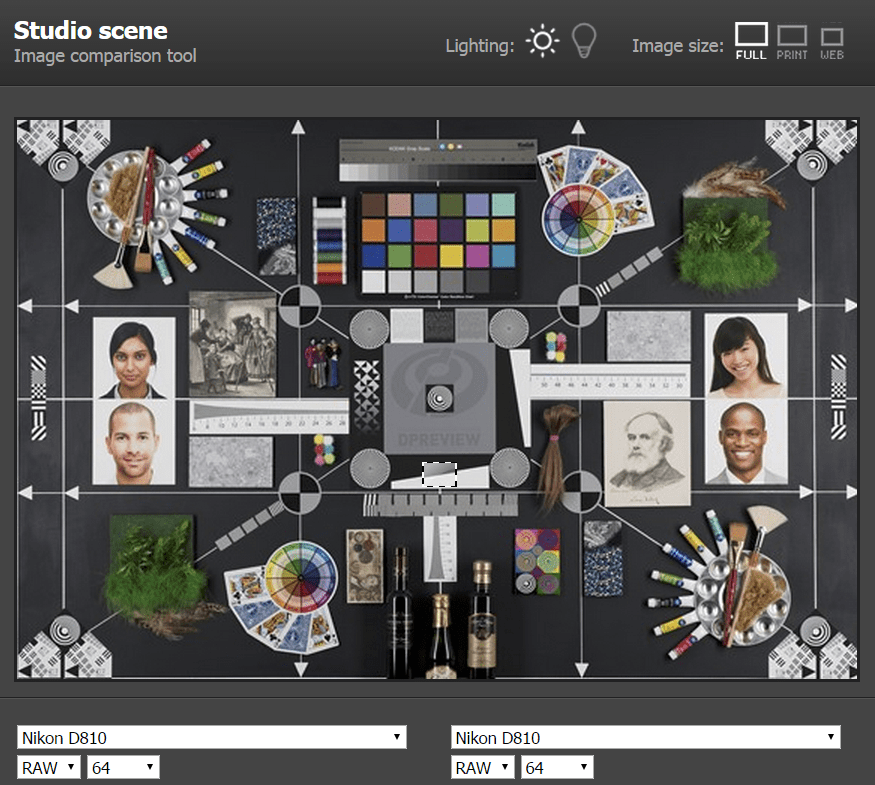 You can see the two slanted edges just below and right of center. For the purposes of this post, store it in the same folder as MTF Mapper.
1) We are going to package the raw file as a TIFF using minimalist converter dcraw with the following command line (if you don’t have dcraw, download it from here – also no installation required, for simplicity now put it in the same folder as MTF Mapper):
dcraw -d -4 -T 0006-ISO64-1_25s.NEF
-d subtracts the black level from the raw data and scales it linearly to full scale, without demosaicing and color transforms
-4 white balances the data based on the in-camera multipliers and sets full scale at16-bits
-T dumps the resulting data to a TIFF file.
2) Next we are going to crop a section of each slanted edge about 100-400 pixels on the long side as shown in dashed lines above by opening the TIFF resulting from step 1) in a 16-bit editor of your choice. Lets call them the horizontal and vertical crops. On the short side, leave at least 30 pixels on either side of the edge. The crops should look something like this once done:
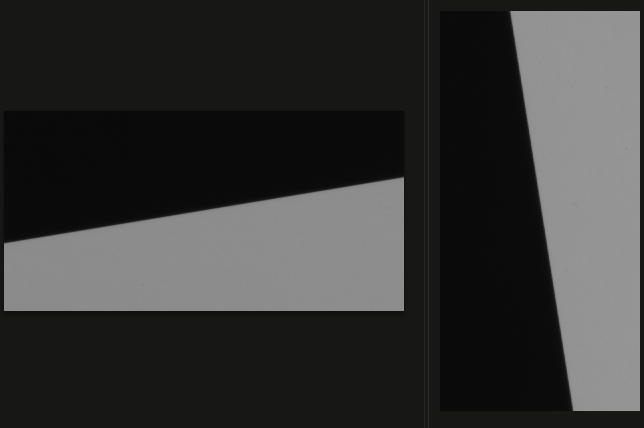
You are looking at full resolution, undemosaiced, white balanced, linear raw data. Note how there is no pixelation in the brighter portions of the edges because DPReview has recently been setting their cameras up with the correct white balance during testing (that’s part of the -4 switch above). Save the two crops as h.tif and v.tif in MTF Mapper’s directory.
3) Run MTF Mapper twice, once for each tif file, renaming the resulting output files by adding a _h and _v extension to each of their names in between runs:
mtf_mapper h.tif x:\outputdir -arbef
mtf_mapper v.tif x:\outputdir -arbef
x:\outputdir is the directory in which you want MTF Mapper to store the output files it generates. Edit it to reflect your setup.
4) Plot the resulting MTF data. You should now have several output files, two of which will be named raw_sfr_values_h.txt and raw_sfr_values_v.txt. Those are the ones that contain MTF data from the two edges (SFR and MTF are used interchangeably in photography). You can import them into Excel or any plotting program of your choice.
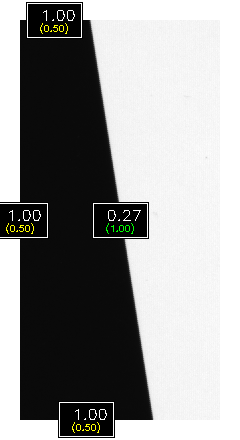
In each file you will see four rows of data for the four edges that MTF Mapper detected, one for our slanted edge and three for the artificial edges resulting from the white frames it puts around images to help it isolate the relevant edge. Here for instance is the slanted edge in the vertical crop, analyzed and annotated (MTF50 at 0.27 cycles per pixel) by MTF Mapper. It provides one dimensional spatial resolution information in the center of the edge, in the direction perpendicular to it:
Back to the spreadsheet, the first column is the angle of the edge with respect to the horizontal or vertical axis, for the case just above the angle is equal to 8.958 degrees. The rest of that row is the MTF curve data, starting with a value of 1, which you can plot in increments of 1/64th of a cycle per pixel. 1 corresponds to zero cycles per pixel, sometimes referred to as DC.
With a little additional information about sensor size and number of pixels the linear spatial resolution units of cy/px on the x-axis can be easily converted to a number of other common ones, such as lp/mm or lw/ph, as described in this post:

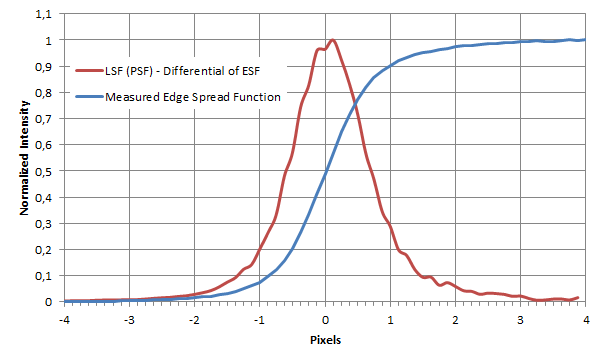
That’s what we are after, the Modulation Transfer Function of the linear, one dimensional point spread function of the imaging system in question in the center of the edge in the direction perpendicular to it.
In this case it has been obtained by using the average spatial resolution information captured by the four raw planes (R, G1, B, G2) of a D810+85mm:1.8G @ f/5.6: full resolution, no demosaicing, no processing, pure IQ information. It relates directly and quantitatively to the performance of the lens, sensor, edge and technique used. By digging into its advanced features, MTF Mapper can also isolate the performance of each color channel, though more care needs to be taken when cropping the edges to ensure proper quartet alignment.
That’s basically it. This procedure is good enough for relative comparisons, say to compare two cameras/lenses that you own. There are better, more precise ways to prepare captures, run MTF Mapper and interpret the resulting measurements than what shown above which can also be used for absolute comparisons.
The other files generated by MTF Mapper are the previously described Edge Spread Function and the Line Spread Function from which MTF is derived – and a record of the MTF50 values in cycles per pixel pitch. If you do not rename them they will get overwritten at each new run. As far as the sharpness conscious average photographer is concerned they are there mainly for diagnostic purposes.
[Edit: It appears that DPReview has updated its Studio Scene Raw files for the D810, so you will be working with different raw data. If they re-shot it, it is most likely because of vibration or focus issues, so the newer file should yield more relevant results.
Fast forward a few years and we are getting MTF50s above 0.45 c/p in the green channel of Full Frame MILCs. That’s not necessarily all good news, given the amount of aliasing that that portends.]