In photography, digital cameras capture information about the scene carried by photons reflected by it and store the information as data in a raw file pretty well linearly. Data is the container, scene information is the substance. There may or may not be information in the data, no matter what its form. With a few limitations what counts is the substance, information, not the form, data.
A Simple Example
Imagine for instance that you are taking stock of the number of remaining pieces in your dinner place settings. You originally had a full set of 6 of everything but today, after many years of losses and breakage, this is the situation in each category:
plates = 1
fruit plates = 1
bowls = 3
forks = 2
knives = 3
spoons = 2
water glasses = 2
wine glasses = 0
If we plot a histogram of the number of items in each category this is what we obtain:
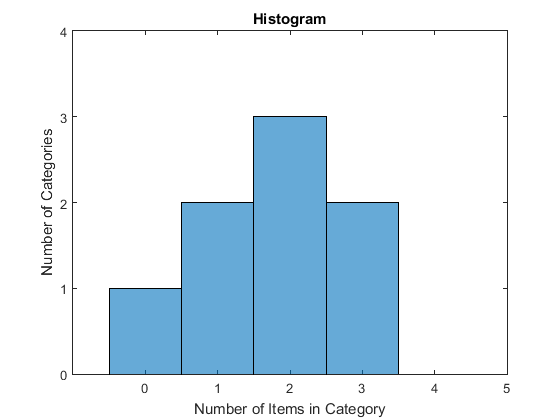
It is clear from this simple example that we only need the numbers 0, 1, 2, 3 in order to fully encode the information in our survey, the number of items of each type/category – and that can be accomplished by using only two bits:
0 = 00, 1 = 01, 2 = 10 and 3 = 11.
All the information coming from the scene can be encoded by two-bit data. A histogram of this data would look just like the one above, with decimal numbers replaced by their 2-bit binary equivalent.
We may decide, however, to store the same information in byte-sized data (8 bits) instead, because that’s how our computer’s memory is set up. The same information will look like this when stored in 8-bit bytes:
0 = 00000000, 1 = 00000001, 2 = 00000010, 3 = 00000011.
8 bits can represent decimal numbers from 0 to 255 if needed, so there are a lot of wasted zero digits saving the information this way, but it’s convenient. If we were to produce a histogram of this byte-sized data it would look just like the one above, with 8-bit binary numbers replacing their decimal equivalent.
Since there is all that extra space in a byte, we may decide to multiply the original collected data by the integer 64 (shift every binary digit 6 places to the left) in order to, say, better allow for the results of further calculations:
0 = 00000000, 1 = 01000000, 2 = 10000000, 3 = 11000000.
If we plotted a histogram of this last set of data, it would look like this, with binary numbers replaced by their decimal equivalent:
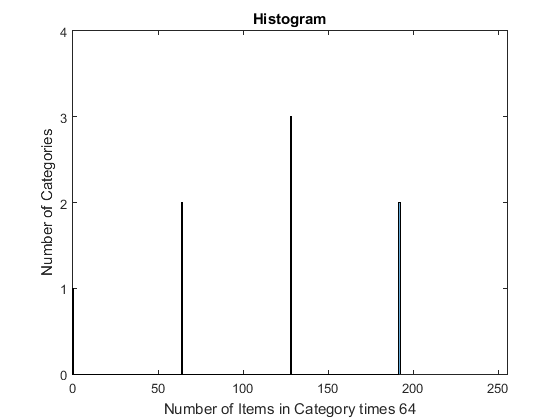
The information shown in this histogram is exactly the same as that shown in the original one, no better and no worse. The information is simply stored differently in the data.
The gaps present in this last histogram have nothing to do with the quality of the information contained in the byte-sized data. If we had chosen to store the same information in 16-bit words, the gaps could become even wider with no loss of Information Quality (IQ): all we would have to do to get back to the original information is simply divide everything by the earlier amplification factor (shift every binary digit back to its original location).
It does not matter whether the amplification/division is performed digitally, analogically, by hand or by computer. As long as it is carried out with precision it will still bring us back to the original information, which contains the results of our survey, with the original accuracy.
There is the Frame, and then there is the Picture
And so it is with light information from the scene collected by the sensor of a digital still camera at a fixed Exposure and stored in its raw data. As long as the original information in units of photoelectrons (e-) is properly treated as it rolls off the photosites, it is amplified, converted to digital and stored, it will not matter whether ISO amplification occurs analogically or digitally as far as IQ in the eventual working data is concerned: the data container may be different but the information contained within it is the same in all cases, assuming noiseless, accurate processing and an ISO invariant system.
Here is the real world example of a histogram from the raw data of an image captured at 14-bit depth with an Exposure of 1/125s, f/2.8 at base ISO. Follow along the steps as in the place setting example.

This is as pure a representation of the information off the photosites as available to this camera at base ISO (not quite ISOless but close). Any further processing – analog or digital, in-camera or in-computer – can at best preserve it but will typically degrade it instead. Information from the scene does not get any better than this.
Final IQ = Product of Individual Information Transfer Functions
Recall the simple model we are using to visualize what happens in-camera when ISO is raised

Think of each stage in the system as having its own Information Transfer Function. The resulting IQ is simply the multiplication of the original image Information off the photosites by each stage’s information transfer function. Up to the raw data the transfer functions are by and large linear.
To further emphasize the difference between data and information let’s take a closer look at amplifying the information from the Exposure that generated the histogram above before storing it in the (raw) data.
Two Ways to Amplify with an ISO Invariant Camera
There are two ways to brighten the image linearly (amplify the data) with an ISOless/invariant camera: raise the ISO in-camera to, say, 1600; or leave the ISO in-camera at base ISO and multiply the raw data digitally by the integer factor 16 as the first step of raw conversion: in some raw converters this is accomplished by the improperly named Exposure Compensation slider.

If the camera is ISO invariant, there should be absolutely no difference in IQ in either case, because the starting information contained in both sets of final data is exactly the same. All we are doing is processing the same information differently and storing it in the same data shell, in this case in the form of 16-bit words, for convenience.
Here are the histograms resulting from the two cases, ISO1600 vs ISO100x16, for the Exposure above at 1/125s, f/2.8. Note the 16 DN gaps in the digitally amplified version (baseISOx16). The gaps are not there in the analogically amplified version (ISO1600) because of noise added by the amplifier. The additional noise makes analog amplification less precise than the digital multiplication described, resulting in pixel values spreading out to neighbouring levels, a process referred to as dithering.

Different Data Does Not Mean Better or Worse IQ
The histograms are a plot of the data, not the information, so they will of course look different as they did in the earlier example. And of course if you were to subtract the images generated by these two sets of data you would find some differences, namely in the noise added by the analog amplifier controlled by the in-camera ISO dial (in this case also because I accidentally moved the camera slightly in between the two captures). But different data does not necessarily mean better or worse image quality, if image information was transferred accurately: the frame may be different but the picture is still the same because it is the result of the same original image information.
The human visual system ‘sees’ information, not data. That’s because it receives information about the scene from photons (emitted by a monitor or reflected by a print) hitting the eyes: as long as the information is there it does not care whether in some intermediate step it was saved as a 16-bit or 32-bit or floating point format.
Gaps in the Histogram: Unrelated to Banding
“Whoa” says the faint-hearted photographer after seeing the latter histogram, “those 16 raw-level gaps will surely be visible in my final picture as horrible banding!”. Don’t bet on it.
Put another way: if you see banding in the ISO1600 image you may also see it in the pushed ISO100 image. Otherwise not. Don’t forget, in an ISO invariant situation image information (IQ) is exactly the same in both cases, even though it has been packaged differently in the x-bit data.
Show Me
In the next article I will show the actual images that produced these histograms for the doubting Thomases amongst us.