We have seen in the last post that Phase One apparently performed a couple of main tweaks to the Color Filter Array of its Medium Format IQ3 100MP back when it introduced the Trichromatic: it made the shapes of color filter sensitivities more symmetric by eliminating residual transmittance away from the peaks; and it boosted the peak sensitivity of the red (and possibly blue) filter. It did this with the objective of obtaining more accurate, less noisy color out of the hardware, requiring less processing and weaker purple fringing to boot.
Both changes carry the compromises discussed in the last article so the purpose of this one and the one that follows is to attempt to measure – within the limits of my tests, procedures and understanding[1] – the effect of the CFA changes from similar raw captures by the IQ3 100MP Standard Back and Trichromatic, courtesy of David Chew. We will concentrate on color accuracy, leaving purple fringing for another time.
Linear Rendering: Accurate, not Necessarily Pleasing
Without further ado, I used Matlab to linearly convert David’s two ColorChecker raw files captured with the Trichromatic (TC) and Standard Back (SB) in very similar conditions. Don’t expect any pop, these images were rendered with the utmost care in preserving linearity from raw data so, other than the derivation and application of dedicated compromise color matrices, no additional processing whatsoever was applied: no HSV table, no ‘look’, no tone curve, no contrast, no sharpening, no nothing. What you see is tone information from the scene as captured by the hardware in its most pristine form: raw data presented in a colorimetric color space and shown by your display system.
So if your display is anything less than a true 14-bit/stop DR monitor viewed in perfect conditions the images will appear low contrast, some people would describe them as being veiled and/or lacking in three-dimensionality. No matter, the objective here is not to produce pleasing images but to just check that the colors obtained from the procedure that I will describe are linearly accurate in the files. And as we know accurate does not always look pleasing with our viewing setup.
The Procedure
The raw files from the two IQ3 100MP backs were converted according to the procedure outlined in the article on rendering, please refer to it if you need additional details.
In a nutshell, the raw file was opened with RawDigger Profile Edition, the raw values of the ColorChecker 24 patch target were read, saved and the entire image exported as an RGGB, black-subtracted, grayscale TIFF. Then:
- Compromise Color Matrices were determined separately for the two backs as described in the relative article (and the dedicated section below):
- the RGGB, black-subtracted TIFFs were loaded into Matlab
- they were white balanced and brightness matched off the third CC24 neutral patch from the right (heretofore referred to as patch 22)
- brightness was further corrected by -0.15 stops equally in both captures so that no highlights were clipped in the final color space in either (patch 22 reads L*47 now)
- the images were demosaiced similarly to dcraw -h, by treating each quartet as a single pixel so that the R and B demosaiced values correspond exactly to the respective raw values, while G is the average of raw g1 and g2 values
- the respective compromise matrices from white balanced raw data to Adobe RGB were applied
- Adobe RGB gamma was applied as-is, without a linear toe.
The images were then loaded into Photoshop where the Adobe RGB tag was applied, they were resized via bicubic and saved to Jpeg with quality 10, for display.
The Result
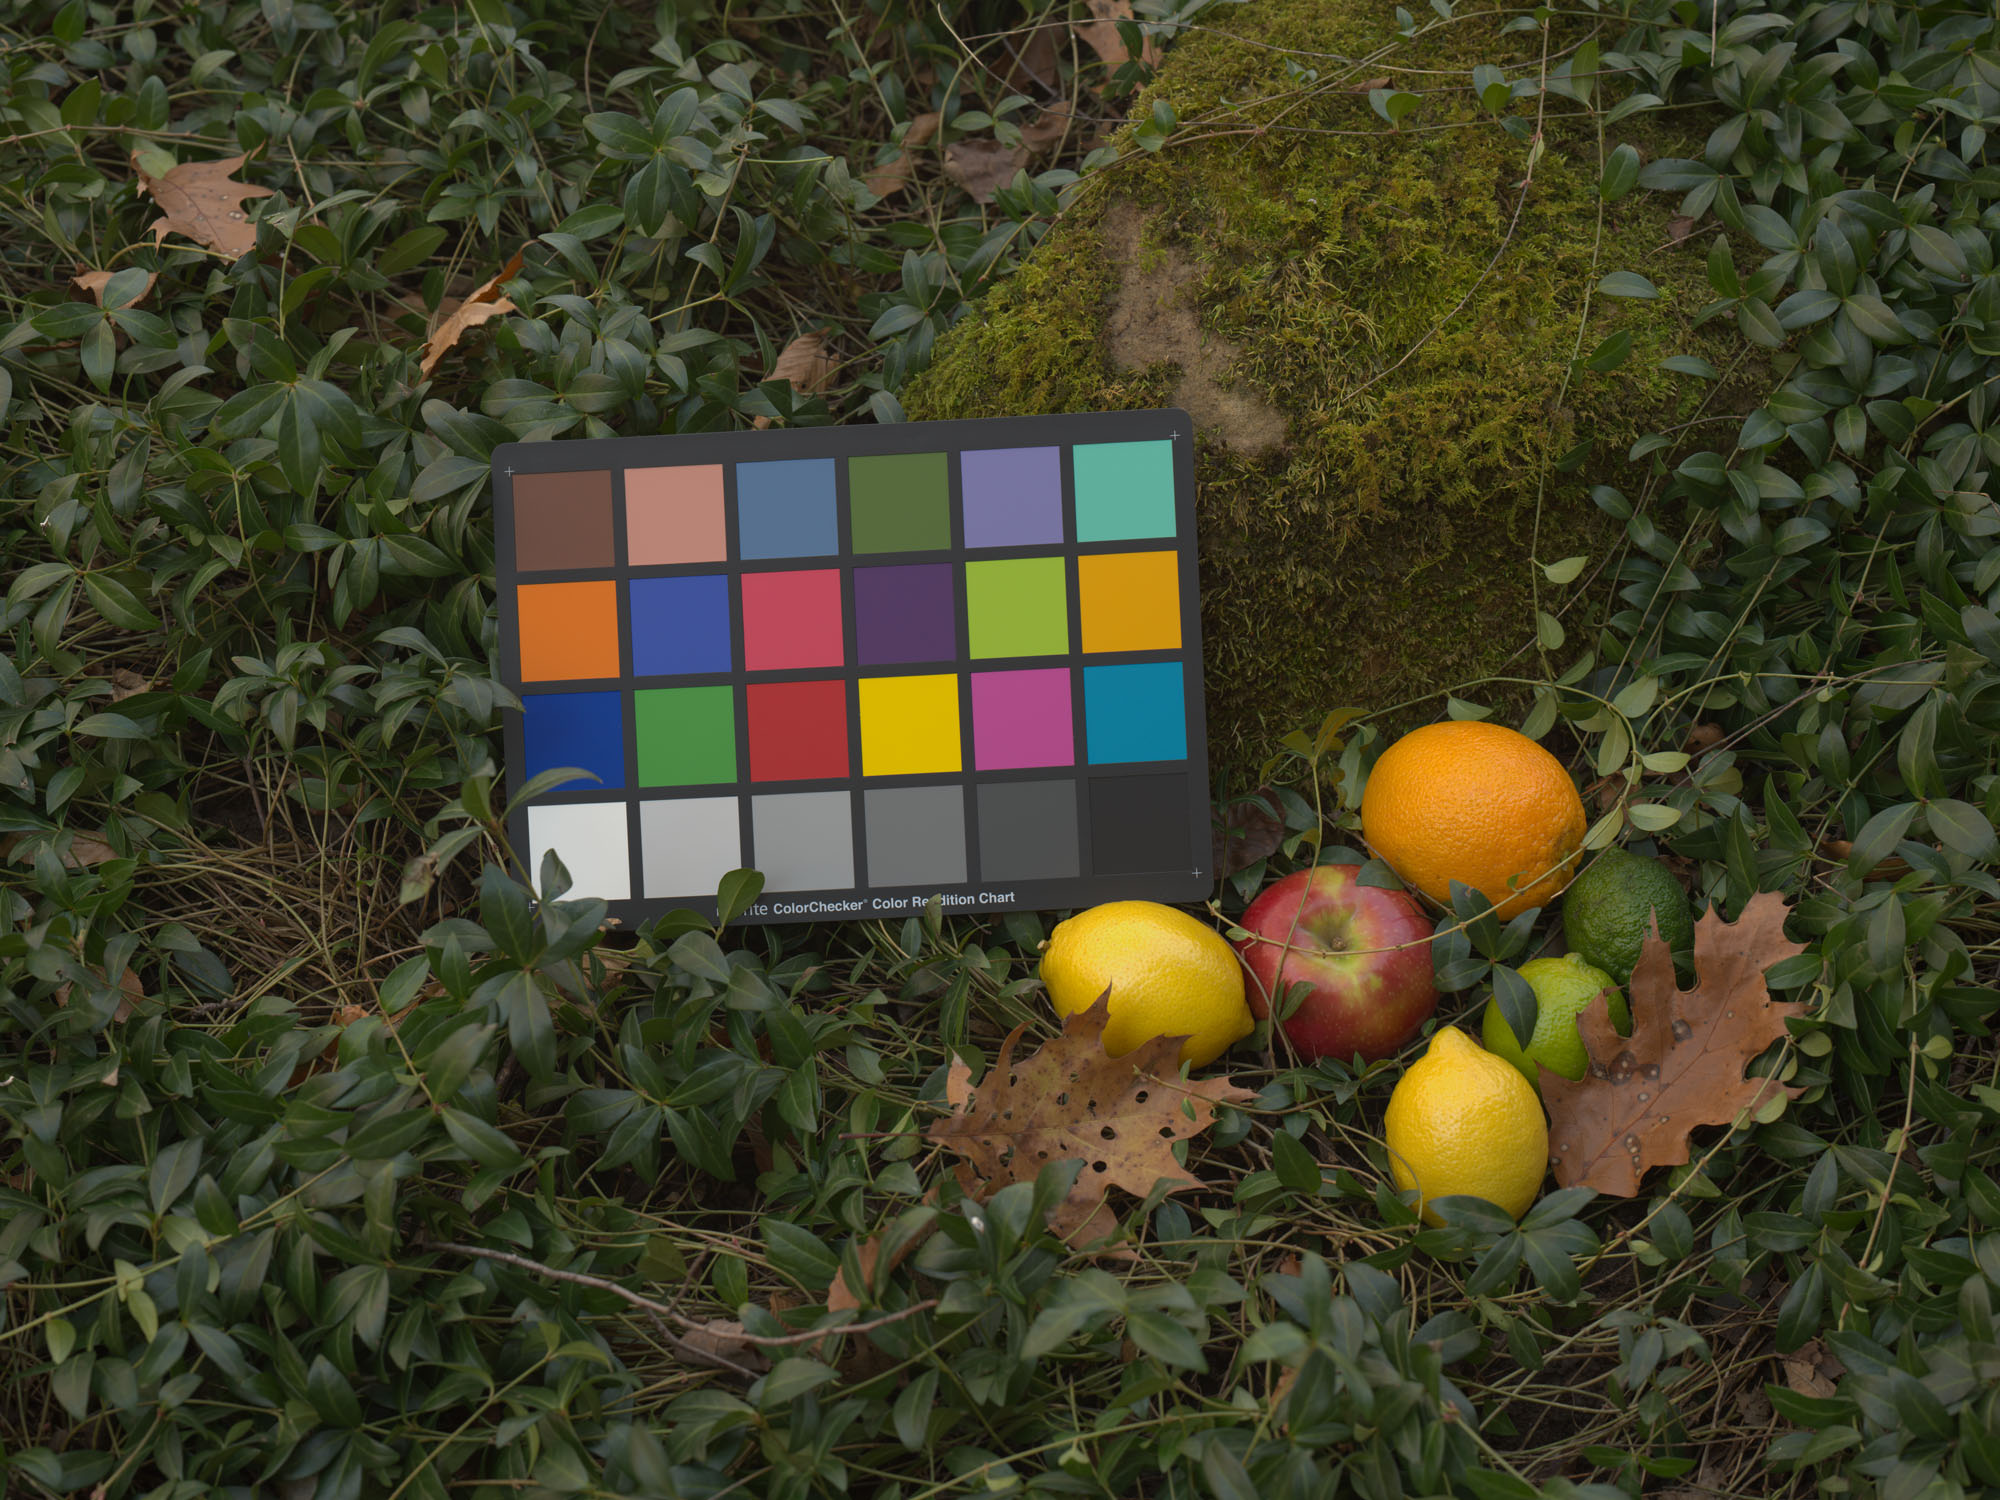
Even though the actual images are not the objective of this investigation, I am going to show them first as a demonstration that the matrices are doing their job. Both captures below were taken within 6 minutes of each other in David’s backyard in the shade, with the same lens at the same relative aperture (he thinks around f/11). The backs were shot at their respective base ISOs: the Trichromatic at ISO35 and the Standard Back at ISO50. Shutter speeds were 1/6s vs 1/8s respectively so the TC ended up with about a 0.41 stop higher exposure, assuming lighting was unchanged[2].
Keep in mind that, as the images below are in the Adobe RGB Color Space, most browsers will display their colors incorrectly. To view them properly you need to download them, open them in a fully color managed environment and view them on a wide gamut display. Feel free to superimpose them, align them and flip back and forth to see differences. Given their makeup I would also suggest viewing them on a dark gray background in a dim environment. Below the IQ3 100MP Standard Back is first, then the Trichromatic:
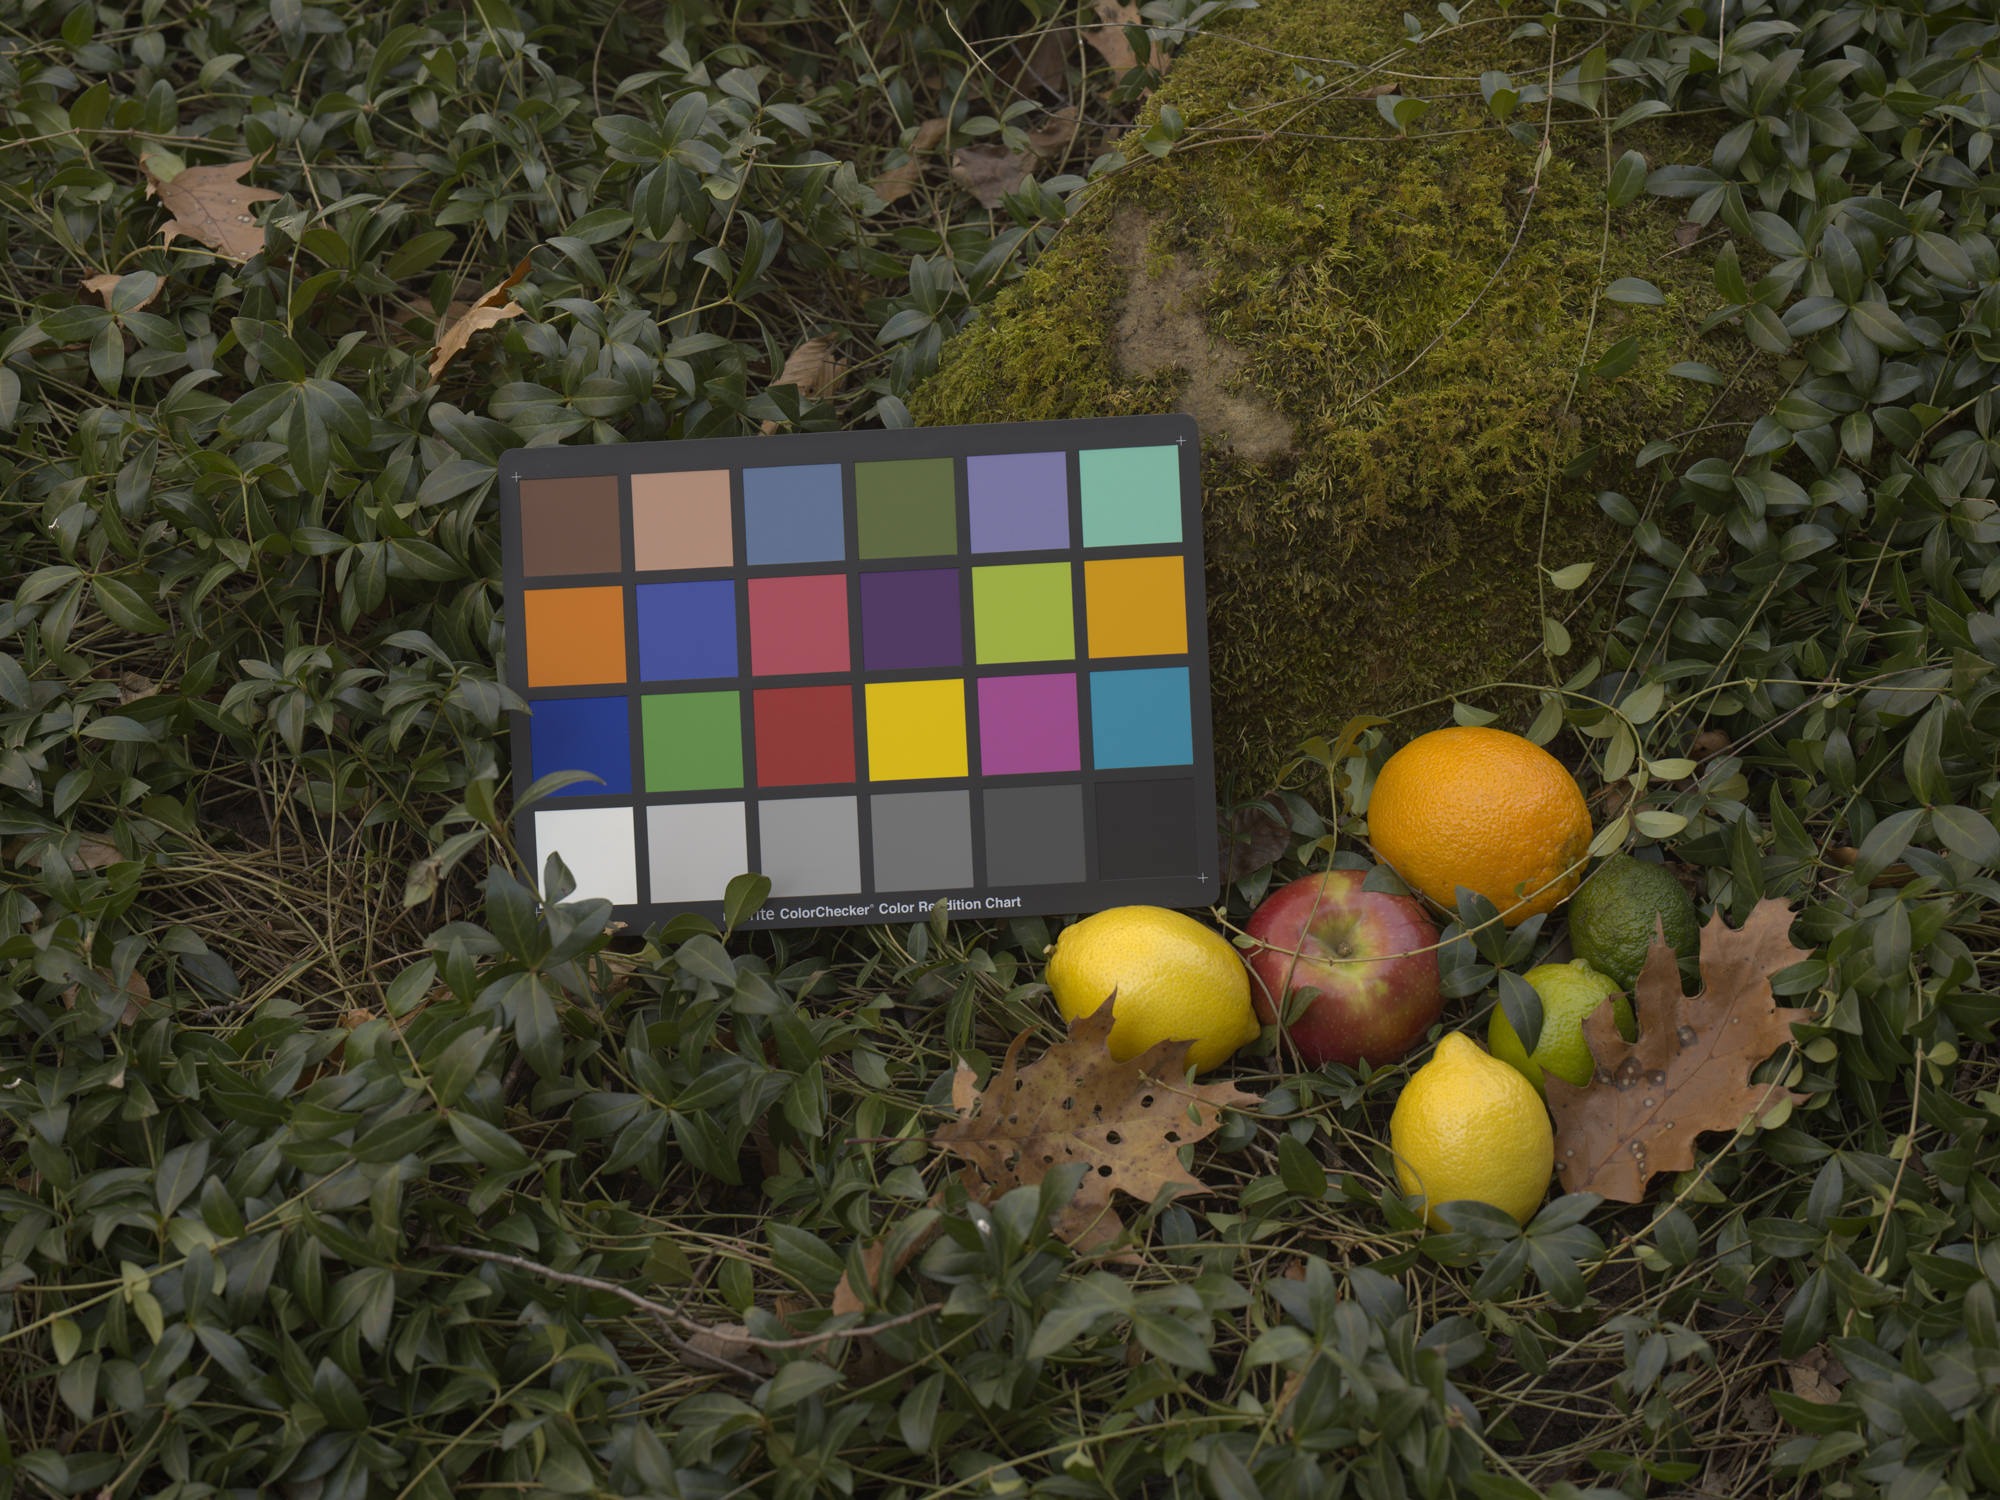

Which one do you prefer? Just kidding. In any case be aware that, except for the dark lime, most of the citrus fruit is out of Adobe RGB’s gamut in both captures, more on that later.
QE Differences
Lots of assumptions here, the main one being equal illumination for both captures, so this paragraph may change as I learn more. But taking a rough look at the data of the second to last neutral patch of the ColorCheckers 24 (patch 23) – whose raw values are between 1 and 10% of full scale where the effects of read noise and PRNU are hopefully minimized – and accounting for the difference in shutter speeds, we see that the Trichromatic’s red and blue channels get about 30% fewer photoelectrons than their Standard Back counterpart all else equal, while the green channel gets around 20% less.

If these rough assumptions hold I would then guess that the TC has an equivalently lower QE compared to the SB. Perhaps that’s one result of the trimming of the CFA sensitivity functions, especially relevant in the red and blue channels. Of course this would make perfect sense in the context of designing a lower base ISO of 35 for the TC vs 50 in the SB. One couldn’t be faulted for having wished for similar average sensitivity in both backs with higher headroom in the newer TC, however.
White Balance Differences
As set up – therefore not accounting for differences in ISO, shutter speed and illumination – the two backs produce approximately equal red and blue mean raw values in the neutral patches but the TC shows about 20% lower greens. This is apparent in the relative CameraNeutral values (in DNG speak), whose reciprocal is multiplied into the raw data to white balance it and obtain neutral gray. Here is CameraNeutral from both captures, the mean raw values off patch 22 normalized to their own green (r,g,b)[3]:
SB = 0.2580 1.0000 0.8719
TC = 0.3314 1.0000 1.0946
The ratios are different than in the e- calculations above because in order to become raw values photoelectrons need to be multiplied by different per channel gains chosen by Phase One engineers. One big difference is that under this moderately cool light (we will see later that its CCT is around 6500K) the blue TC CameraNeutral is actually greater than green, while it is lower in the SB. As was explained in the previous article, having blue or red above green may not be desirable in part because there are twice as many green pixels as there are red and blue – and the human eye is most sensitive to green. On the other hand red is more relevant in the TC, which in this scene is obviously welcome.
The Illuminant: Approximately D65
Without the benefit of starting matrices it is impossible to calculate the correlated color temperature of the illuminant – and the two backs’ in-file matrices appeared weird, almost half baked. Phase One, however, knows them. I don’t have Capture One but fortunately David does and he got a white balance reading of about 6574K from the TC raw file. I was able to open the SB raw file in RawTherapee 5.3 and got a correlated color temperature of 6450K[4] – so for the rest of this exercise I will assume that the illuminant was about D65, which makes some sense given a shady November morning in Ohio.
The Matrices
With the raw values of the 24 ColorChecker patches, CameraNeutral and estimated illuminant correlated color temperature in hand for both backs we can now estimate their respective Compromise Color Matrices. The important job of the matrix is to take the white balanced raw data and convert it linearly into the perceptual CIE XYZ color space. By comparing the XYZ values of the 24 ColorChecker patches from the raw files of the two backs to published reference XYZ values we can estimate how ‘accurately’ the hardware is able to capture tones, at least as it pertains to this limited set of ‘colors’.
To compute the reference values I used the average Spectral Reflectance of pre-2015 ColorChecker 24s from BabelColor‘s database lit by D65 in the 380-730nm range. Following the procedure outlined in the Forward Matrix article I used Matlab’s lsqnonlin algorithm twice to determine the matrix that minimizes dE2000 differences to reference values in all 24 of the ColorChecker patches for each back.
Below you can see how the two raw files faired with this setup on the standard xy chromaticity diagram: the white circles are centered on BabelColor’s reference XYZ values (their size is arbitrary); the black dots are xy coordinates from the Standard Back; the gray dots are from the Trichromatic.

Since the XYZ color space is not very uniform the shown chromaticity differences only have qualitative value. We will explore quantitative results in the next article.
Notes and References
1. Lots of provisos and simplifications for clarity as always. I am not a color scientist, so if you spot any mistakes please let me know.
2. If you are interested you can download the two files and read David’s capture notes in this getDPI thread.
3. Note that if you multiplied TC’s CameraNeutral by 0.8, red and blue would more or less match SB but green would be 0.8.
4. I use patch 22 (third patch from right on the bottom) because it is typically the most neutral of the neutrals and it represents about L*50.