Tag Archives: Phase One

Capture Sharpening: Estimating Lens PSF

The next few articles will outline the first tiny few steps towards achieving perfect capture sharpening, that is deconvolution of an image by the Point Spread Function (PSF) of the lens used to capture it.  This is admittedly  a complex subject, fraught with a myriad ever changing variables even in a lab, let alone in the field.  But studying it can give a glimpse of the possibilities and insights into the processes involved.

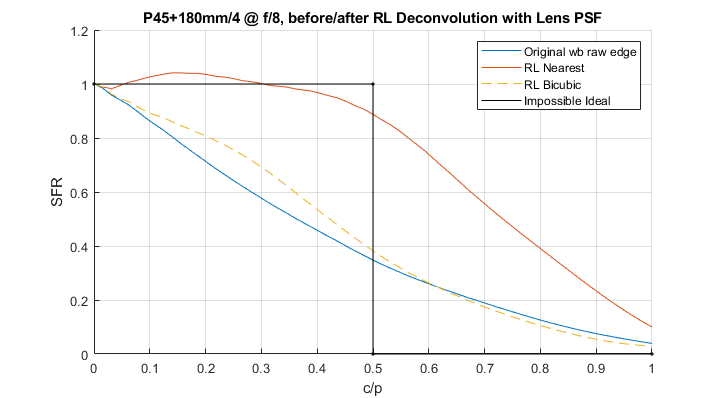
I will explain the steps I followed and show the resulting images and measurements.  Jumping the gun, the blue line below represents the starting system Spatial Frequency Response (SFR)[1], the black one unattainable/undesirable perfection and the orange one the result of part of the process outlined in this series.

Figure 1. Spatial Frequency Response of the imaging system before and after Richardson-Lucy deconvolution by the PSF of the lens that captured the original image.

Continue reading Capture Sharpening: Estimating Lens PSF

Phase One IQ3 100MP Trichromatic vs Standard Back Linear Color, Part II

We have seen in the last post that Phase One apparently performed a couple of main tweaks to the Color Filter Array of its Medium Format IQ3 100MP back when it introduced the Trichromatic:  it made the shapes of color filter sensitivities more symmetric by eliminating residual transmittance away from the peaks; and it boosted the peak sensitivity of the red (and possibly blue) filter.  It did this with the objective of obtaining more accurate, less noisy color out of the hardware, requiring less processing and weaker purple fringing to boot.

Both changes carry the compromises discussed in the last article so the purpose of this one and the one that follows is to attempt to measure – within the limits of my tests, procedures and understanding[1] – the effect of the CFA changes from similar raw captures by the IQ3 100MP Standard Back and Trichromatic, courtesy of David Chew.  We will concentrate on color accuracy, leaving purple fringing for another time.

Figure 1. Phase One IQ3 100MP image rendered linearly via a dedicated color matrix from raw data without any additional processing whatsoever: no color corrections, no tone curve, no sharpening, no nothing. Brightness adjusted to just avoid clipping.  Capture by David Chew.

Continue reading Phase One IQ3 100MP Trichromatic vs Standard Back Linear Color, Part II

Phase One IQ3 100MP Trichromatic vs Standard Back Linear Color, Part I

It is always interesting when innovative companies push the envelope of the state-of-the-art of a single component in their systems because a lot can be learned from before and after comparisons.   I was therefore excited when Phase One introduced a Trichromatic version of their Medium Format IQ3 100MP Digital Back last September because it could allows us to isolate the effects of tweaks to their Bayer Color Filter Array, assuming all else stays the same.

Figure 1. IQ3 100MP Trichromatic (left) vs the rest (right), from PhaseOne.com.   Units are not specified but one would assume that the vertical axis is relative spectral sensitivity and the horizontal axis represents wavelength.

Thanks to two virtually identical captures by David Chew at getDPI, and Erik Kaffehr’s intelligent questions at DPR, in the following articles I will explore the effect on linear color of the new Trichromatic CFA (TC) vs the old one on the Standard Back (SB).  In the process we will discover that – within the limits of my tests, procedures and understanding[1] – the Standard Back produces apparently more ‘accurate’ color while the Trichromatic produces better looking matrices, potentially resulting in ‘purer’ signals. Continue reading Phase One IQ3 100MP Trichromatic vs Standard Back Linear Color, Part I