The Raspberry Pi Foundation recently released an interchangeable lens camera module based on the Sony IMX477, a 1/2.3″ back side illuminated sensor with 3040×4056 pixels of 1.55um pitch. In this somewhat technical article we will unpack the 12-bit raw still data that it produces and render it in a convenient color space.
Figure 1. 12-bit raw capture by Raspberry Pi High Quality Camera with 16 mm kit lens at f/8, 1/2 s, base ISO. The image was loaded into Matlab and rendered Half Height Nearest Neighbor in the Adobe RGB color space with a touch of local contrast and sharpening. Click on it to see it in its own tab and view it at 100% magnification. If your browser is not color managed you may not see colors properly.
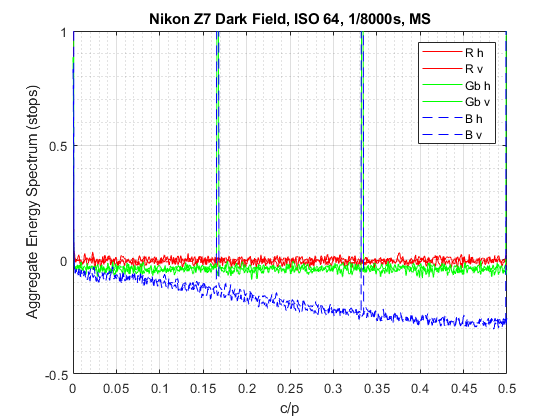
A spectrogram, also sometimes referred to as a periodogram, is a visual representation of the Power Spectrum of a signal. Power Spectrum answers the question “How much power is contained in the frequency components of the signal”. In digital photography a Power Spectrum can show the relative strength of repeating patterns in captures and whether processing has been applied.
In this article I will describe how you can construct a spectrogram and how to interpret it, using dark field raw images taken with the lens cap on as an example. This can tell us much about the performance of our imaging devices in the darkest shadows and how well tuned their sensors are there.
Figure 1. Horizontal and Vertical Spectrogram of noise captured in the raw data by a Nikon Z7 at base ISO with the lens cap on. The plot shows clear evidence of low-pass filtering in the blue CFA color plane and pattern noise repeating every 6 rows there and in one of the green ones.