Tag Archives: normal

The HV Spectrogram

A spectrogram, also sometimes referred to as a periodogram, is  a visual representation of the Power Spectrum of a signal.  Power Spectrum answers the question “How much power is contained in the frequency components of the signal”. In digital photography a Power Spectrum can show the relative strength of repeating patterns in captures and whether processing has been applied.

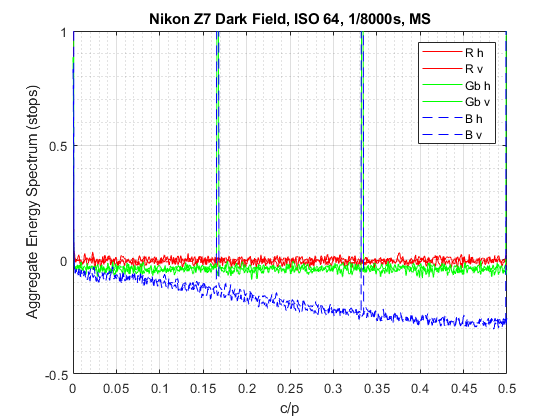
In this article I will describe how you can construct a spectrogram and how to interpret it, using dark field raw images taken with the lens cap on as an example.  This can tell us much about the performance of our imaging devices in the darkest shadows and how well tuned their sensors are there.

Pixel level noise spectrum
Figure 1. Horizontal and Vertical Spectrogram of noise captured in the raw data by a Nikon Z7 at base ISO with  the lens cap on.  The plot shows clear evidence of low-pass filtering in the blue CFA color plane and pattern noise repeating every 6 rows there and in one of the green ones.

Continue reading The HV Spectrogram

What Radius to Use for Deconvolution Capture Sharpening

The following approach will work if you know the spatial frequency at which a certain MTF relative energy level (e.g. MTF50) is achieved by your camera/lens combination as set up at the time that the capture was taken.

The process by which our hardware captures images and stores them  in the raw data inevitably blurs detail information from the scene. Continue reading What Radius to Use for Deconvolution Capture Sharpening